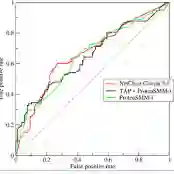
Probability forecasts for binary outcomes, often referred to as probabilistic classifiers or confidence scores, are ubiquitous in science and society, and methods for evaluating and comparing them are in great demand. We propose and study a triptych of diagnostic graphics that focus on distinct and complementary aspects of forecast performance: The reliability diagram addresses calibration, the receiver operating characteristic (ROC) curve diagnoses discrimination ability, and the Murphy diagram visualizes overall predictive performance and value. A Murphy curve shows a forecast's mean elementary scores, including the widely used misclassification rate, and the area under a Murphy curve equals the mean Brier score. For a calibrated forecast, the reliability curve lies on the diagonal, and for competing calibrated forecasts, the ROC and Murphy curves share the same number of crossing points. We invoke the recently developed CORP (Consistent, Optimally binned, Reproducible, and Pool-Adjacent-Violators (PAV) algorithm based) approach to craft reliability diagrams and decompose a mean score into miscalibration (MCB), discrimination (DSC), and uncertainty (UNC) components. Plots of the DSC measure of discrimination ability versus the calibration metric MCB visualize classifier performance across multiple competitors. The proposed tools are illustrated in empirical examples from astrophysics, economics, and social science.
翻译:针对二元结果的概率预测(通常称为概率分类器或置信度评分)在科学与社会中无处不在,对其评估与比较的方法需求日益增长。我们提出并研究了一套由三个诊断图形构成的“三部曲”,分别关注预测性能的不同且互补的方面:可靠性图用于校准评估、受试者工作特征曲线用于判别能力诊断、墨菲图用于整体预测性能与价值可视化。墨菲曲线展示预测的平均基本评分(包括广泛使用的误分类率),其曲线下面积等于平均布里尔评分。对于校准后的预测,可靠性曲线位于对角线上;而对于竞争性校准预测,ROC曲线与墨菲曲线具有相同数量的交叉点。我们采用近期发展的CORP方法(基于一致、最优分箱、可重复及保序连接准则)构建可靠性图,并将平均评分分解为误校准、判别能力与不确定性三个分量。通过判别能力测量值DSC与校准度量MCB的对比图,可直观评估多个竞争性分类器的性能。本文提出的工具在天体物理学、经济学与社会科学等领域的实证案例中得到应用验证。