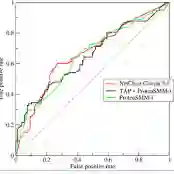
Receiver operating characteristic (ROC) analysis is a tool to evaluate the capacity of a numeric measure to distinguish between groups, often employed in the evaluation of diagnostic tests. Overall classification ability is sometimes crudely summarized by a single numeric measure such as the area under the empirical ROC curve. However, it may also be of interest to estimate the full ROC curve while leveraging assumptions regarding the nature of the data (parametric) or about the ROC curve directly (semiparametric). Although there has been recent interest in methods to conduct comparisons by way of stochastic ordering, nuances surrounding ROC geometry and estimation are not widely known in the broader scientific and statistical community. The overarching goals of this manuscript are to (1) provide an overview of existing frameworks for ROC curve estimation with examples, (2) offer intuition for and considerations regarding methodological trade-offs, and (3) supply sample R code to guide implementation. We utilize simulations to demonstrate the bias-variance trade-off across various methods. As an illustrative example, we analyze data from a recent cohort study in order to compare responses to SARS-CoV-2 vaccination between solid organ transplant recipients and healthy controls.
翻译:接收者操作特征(ROC)分析是一种用于评估数值指标区分组别能力的工具,常被应用于诊断测试的评估中。整体分类能力有时通过单一数值指标(如经验ROC曲线下面积)粗略概括。然而,在利用关于数据性质(参数化)或直接关于ROC曲线(半参数化)的假设的同时,估计完整的ROC曲线也可能具有研究价值。尽管近期出现了通过随机排序进行比较的方法研究,但关于ROC几何特性与估计的细微差别在更广泛的科学和统计学界尚未被广泛认知。本文的核心目标在于:(1)通过实例概述现有ROC曲线估计框架;(2)提供关于方法权衡的直观理解与考量;(3)提供示例R代码以指导实施。我们通过模拟演示不同方法间的偏差-方差权衡。作为示例,我们分析了一项近期队列研究的数据,以比较实体器官移植受者与健康对照者对SARS-CoV-2疫苗接种的反应差异。