

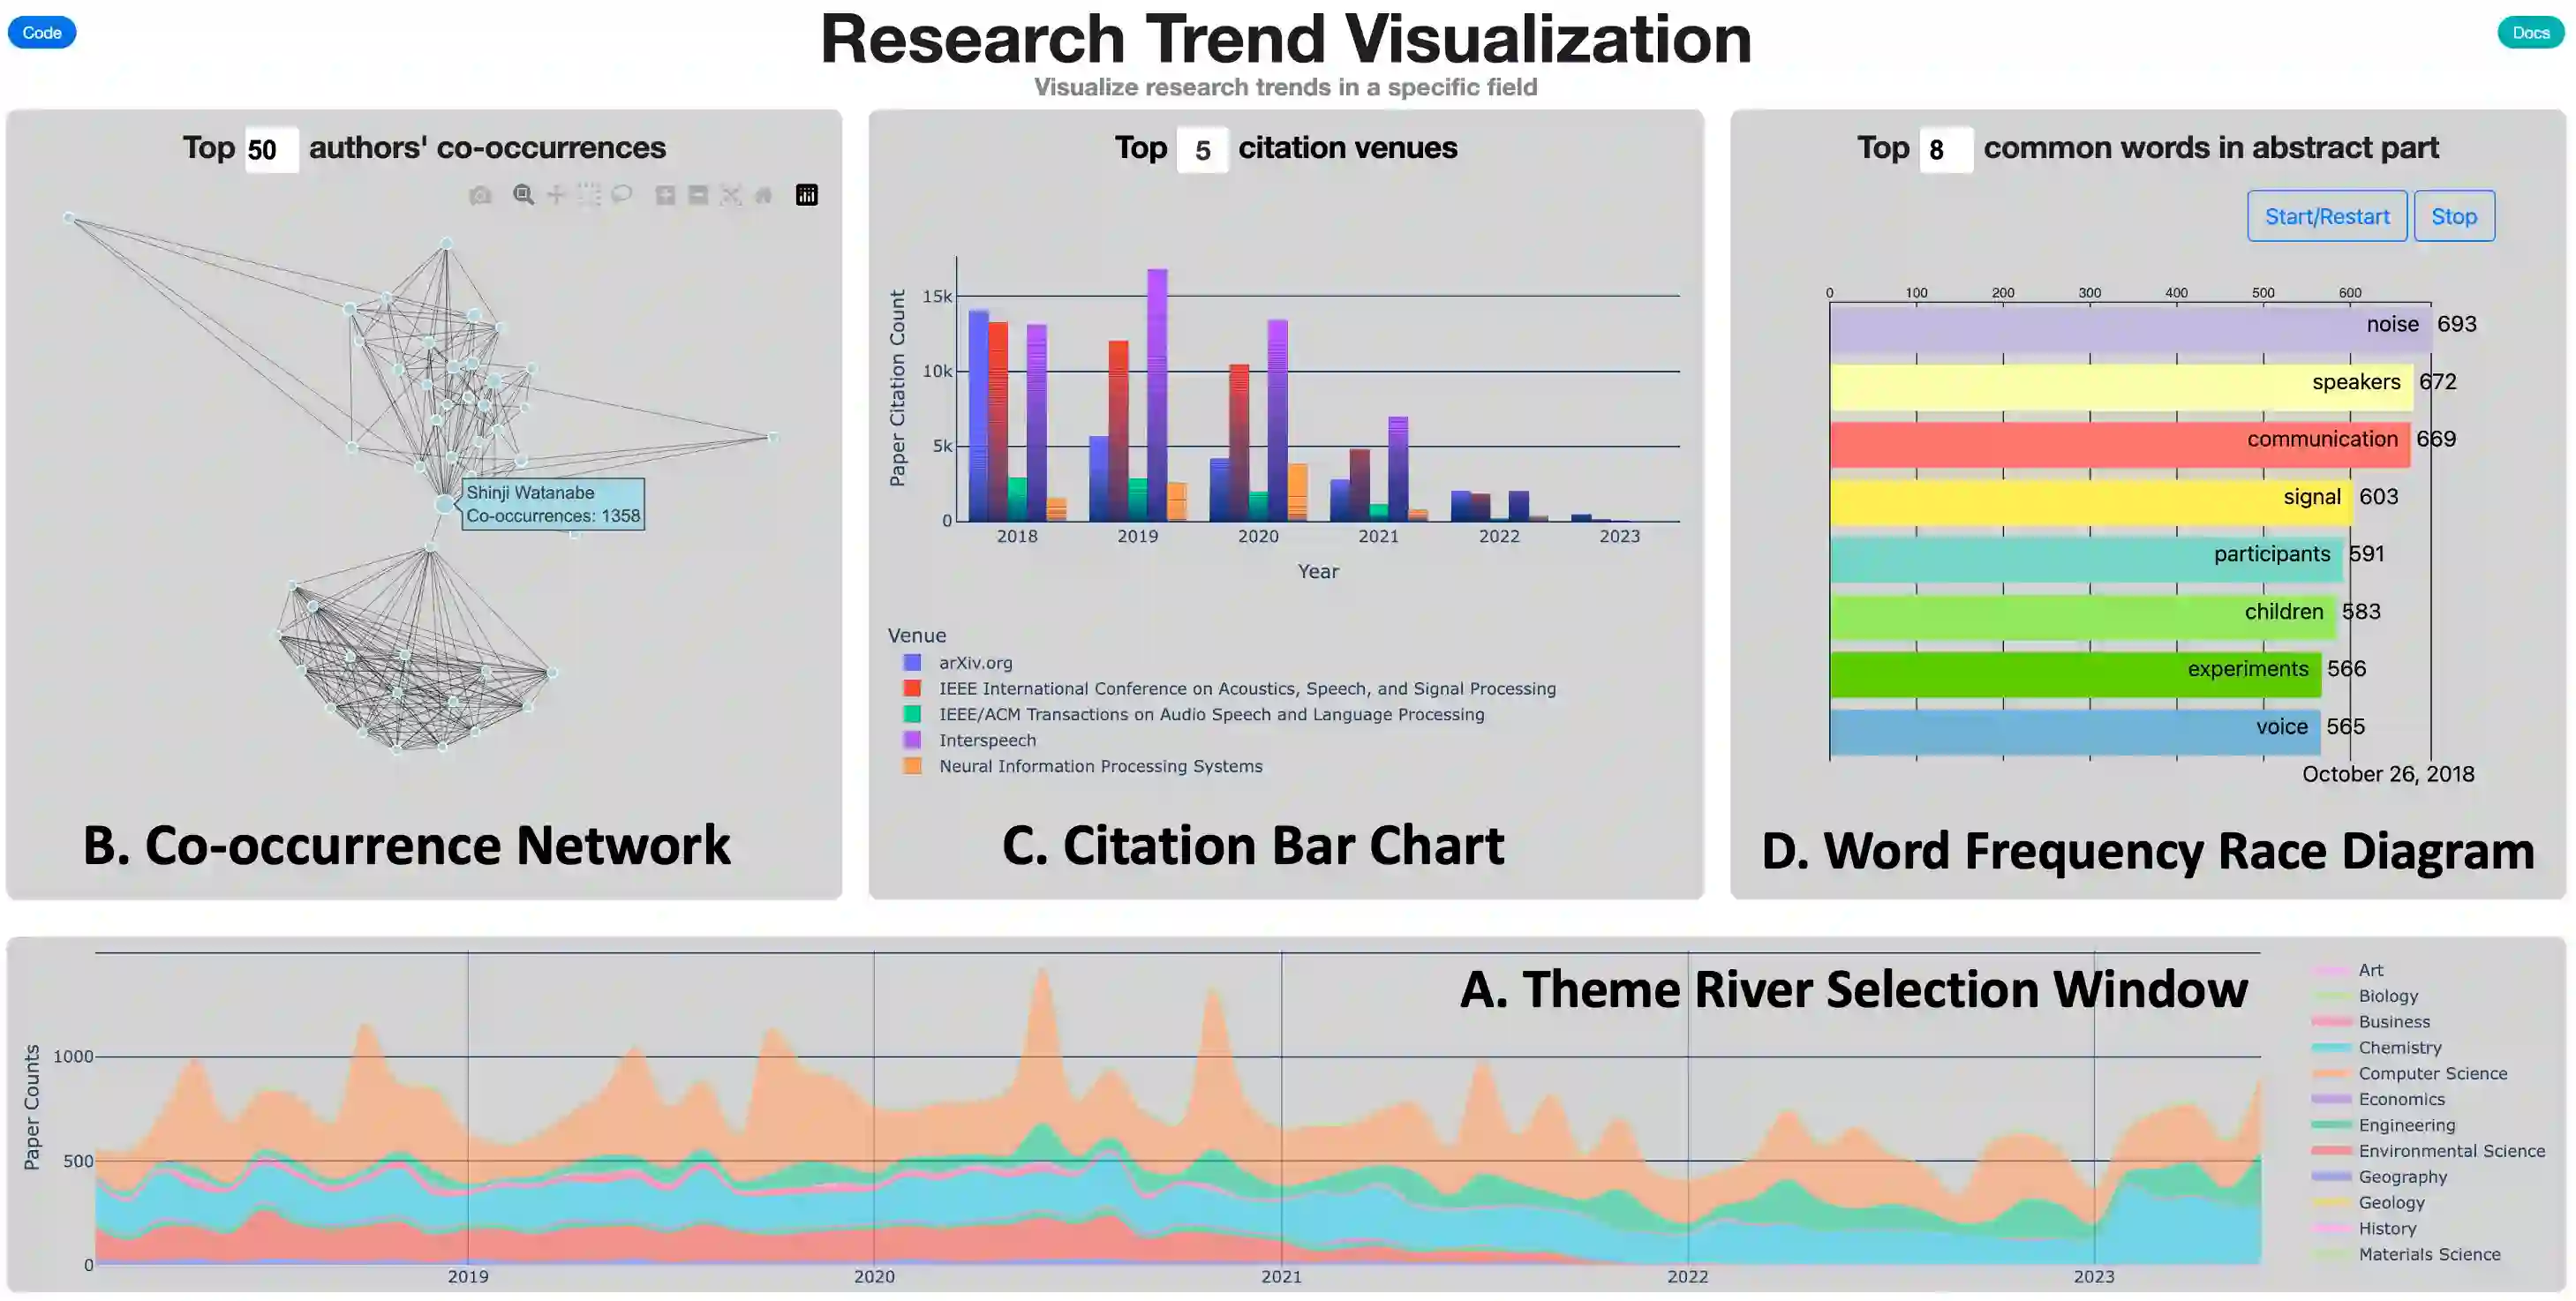
When researchers and practitioners are about to start a new project or have just entered a new research field, choosing a proper research topic is always challenging. To help them have an overall understanding of the research trend in real-time and find out the research topic they are interested in, we develop the Research Trend Visualization toolkit (RTVis) to analyze and visualize the research paper information. RTVis consists of a field theme river, a co-occurrence network, a specialized citation bar chart, and a word frequency race diagram, showing the field change through time respectively, cooperating relationship among authors, paper citation numbers in different venues, and the most common words in the abstract part. Moreover, RTVis is open source and easy to deploy. The demo of our toolkit and code with detailed documentation are both available online.
翻译:当研究人员和实践者即将开始一个新项目或刚进入一个新研究领域时,选择合适的课题始终是一项挑战。为帮助他们实时了解研究趋势并找到自己感兴趣的研究主题,我们开发了研究趋势可视化工具包(RTVis),用于分析和可视化论文信息。RTVis由领域主题河流图、共现网络、专业引文柱状图和词频竞赛图组成,分别展示领域随时间的变化、作者间的合作关系、论文在不同会议/期刊中的被引次数以及摘要部分的高频词汇。此外,RTVis是开源的且易于部署,工具包的演示程序及附带详细文档的代码均可在网上获取。




相关内容




 微信扫码咨询专知VIP会员