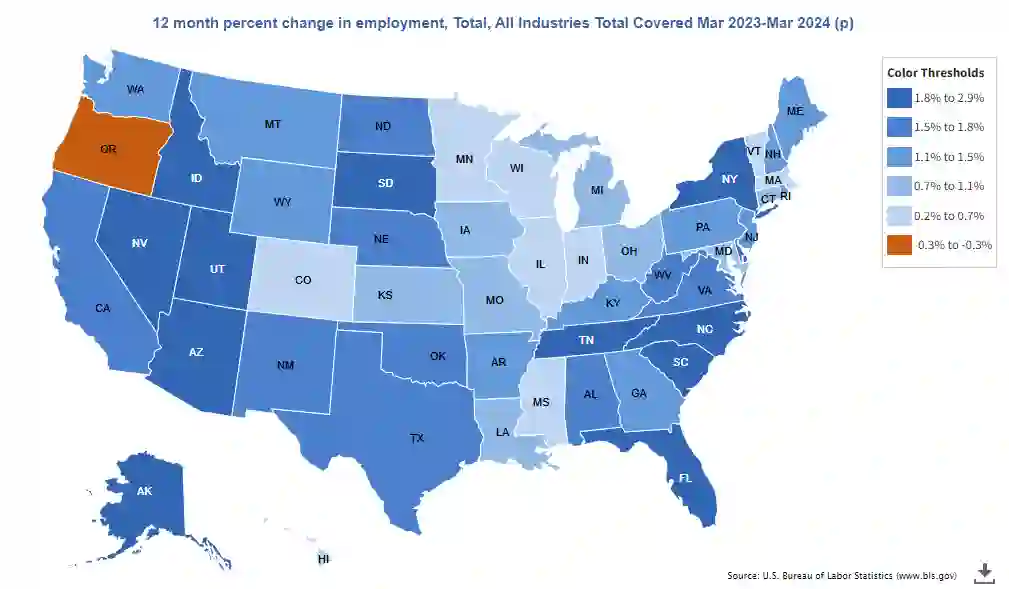
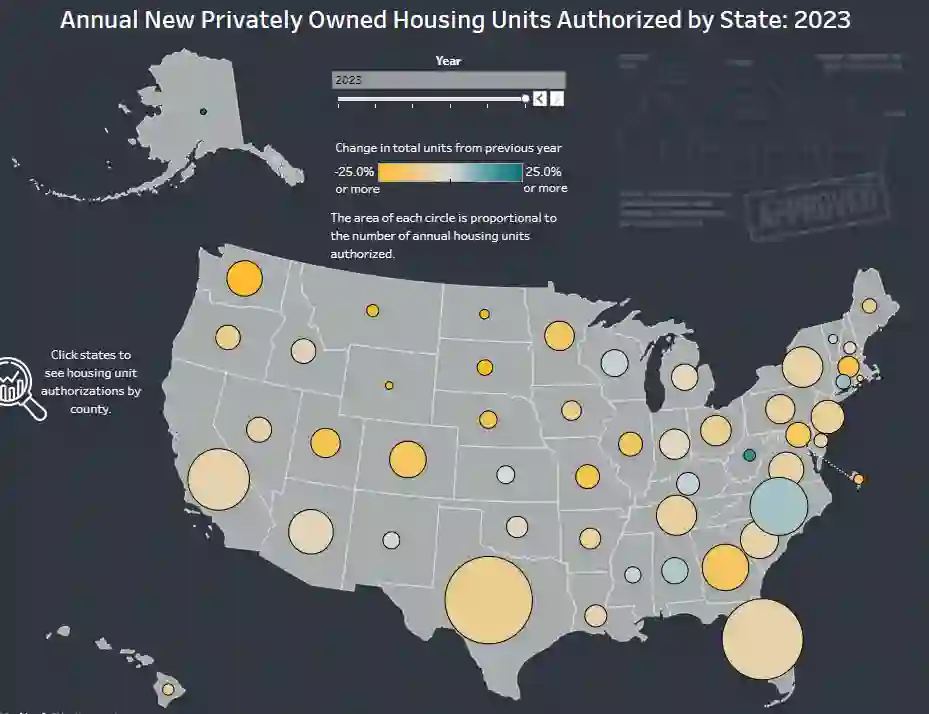
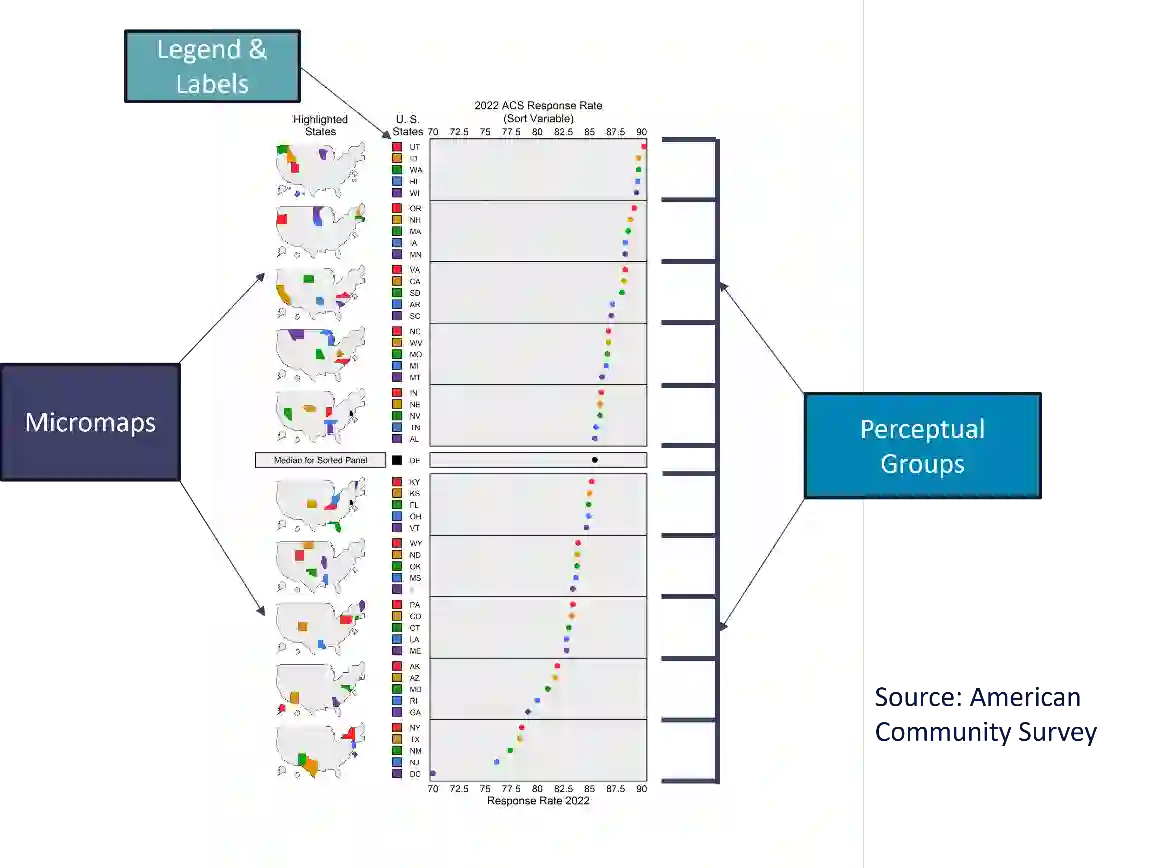
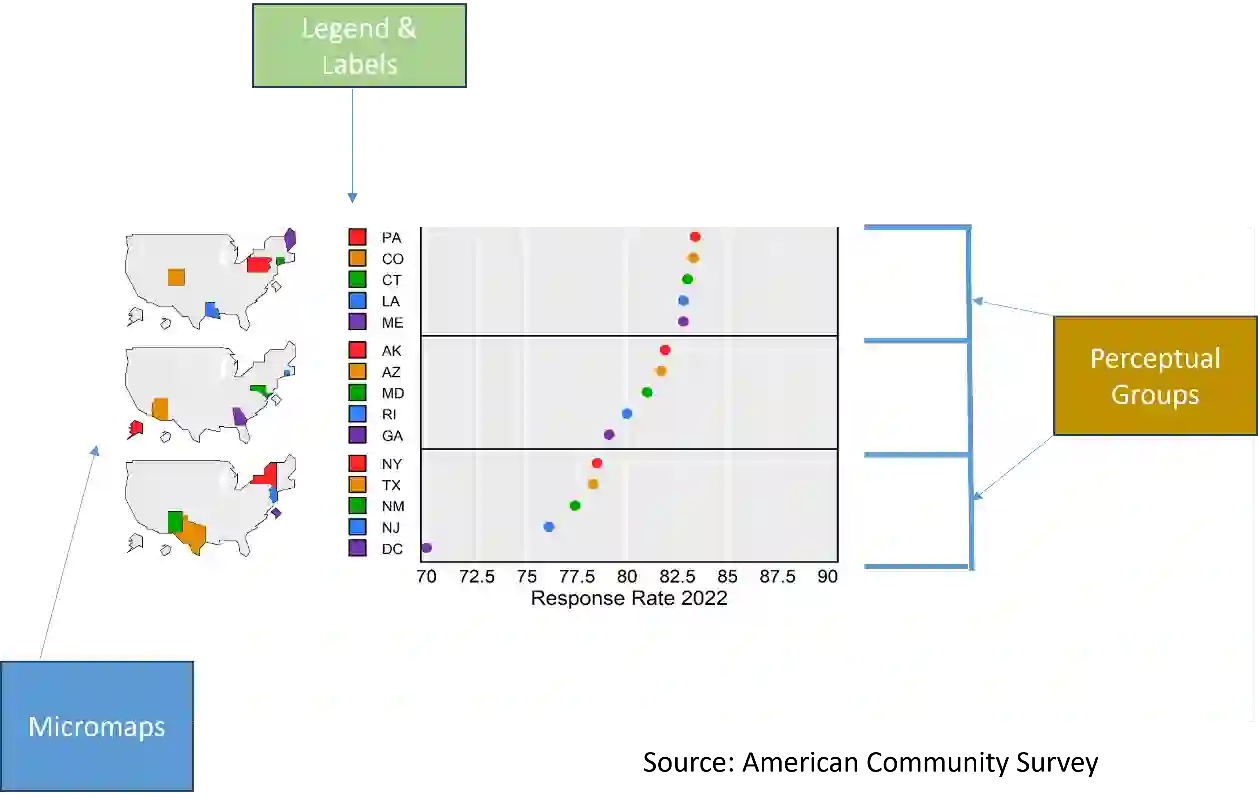
Linked micromaps were originally developed to display geographically indexed statistics in an intuitive way by connecting them to a sequence of small maps. The approach integrates several visualization design principles, such as small multiples, discrete color indexing, and ordering. Linked micromaps allow for other types of data displays that are connected to and conditional on geographic areas. Initial applications of micromaps used data from the National Cancer Institute and the Environmental Protection Agency. In this paper, we will show how linked micromaps can be used to better understand and explore relationships and distributions of statistics linked to US states and Washington, DC. We will compare linked micromaps with other popular data displays of geographic data, such as bubble maps, choropleth maps, and bar charts. We will illustrate how linked micromaps can be used for evidence-based decision-making using data from the Bureau of Labor Statistics, the Census Bureau, and the Economic Research Service. The presentations, R scripts, and the data sets used in this article are available here: https://github.com/wlmcensus/Joint-Statistical-Meetings-Presentation-2024. The work discussed in this article was presented at the Joint Statistical Meetings (JSM) 2024 and the American Association for Public Opinion Research (AAPOR) 2024 Annual Conference.
翻译:关联微地图最初是为了直观展示地理索引统计数据而开发的,其方法是将数据与一系列小地图相连接。该技术融合了多种可视化设计原则,如小型多图、离散色彩索引和排序机制。关联微地图支持其他类型的数据展示形式,这些展示与地理区域相关联并以其为条件。微地图的早期应用采用了美国国家癌症研究所和环境保护署的数据。本文将通过关联微地图,深入解析与美国各州及华盛顿特区相关联的统计数据间的相互关系与分布特征。我们将对比关联微地图与气泡图、分级统计地图及条形图等常见地理数据可视化方法的优劣。借助美国劳工统计局、人口普查局和经济研究局的数据,我们将演示如何运用关联微地图实现证据驱动的决策过程。本文涉及的演示材料、R脚本及数据集可通过以下链接获取:https://github.com/wlmcensus/Joint-Statistical-Meetings-Presentation-2024。本文研究成果已在2024年联合统计会议(JSM)及美国民意研究协会(AAPOR)2024年度会议上发表。