Scatterplots are a common tool for exploring multidimensional datasets, especially in the form of scatterplot matrices (SPLOMs). However, scatterplots suffer from overplotting when categorical variables are mapped to one or two axes, or the same continuous variable is used for both axes. Previous methods such as histograms or violin plots use aggregation, which makes brushing and linking difficult. To address this, we propose gatherplots, an extension of scatterplots to manage the overplotting problem. Gatherplots are a form of unit visualization, which avoid aggregation and maintain the identity of individual objects to ease visual perception. In gatherplots, every visual mark that maps to the same position coalesces to form a packed entity, thereby making it easier to see the overview of data groupings. The size and aspect ratio of marks can also be changed dynamically to make it easier to compare the composition of different groups. In the case of a categorical variable vs. a categorical variable, we propose a heuristic to decide bin sizes for optimal space usage. To validate our work, we conducted a crowdsourced user study that shows that gatherplots enable people to assess data distribution more quickly and more correctly than when using jittered scatterplots.
翻译:散点图是探索多维数据集的常用工具,尤其在散点图矩阵(SPLOM)形式中。然而,当分类变量映射到一个或两个轴,或同一连续变量被用于两个轴时,散点图会出现过度绘制问题。以往的方法如直方图或小提琴图采用聚合方式,这使得刷选和关联操作变得困难。为解决这一问题,我们提出了“聚散图”(gatherplots),这是散点图的一种扩展,用于管理过度绘制问题。聚散图是一种单元可视化形式,它避免聚合且保持单个对象的标识,以简化视觉感知。在聚散图中,映射到同一位置的每个视觉标记会聚合形成一个紧凑实体,从而更易于观察数据分组的概貌。标记的大小和纵横比也可动态调整,以更便于比较不同分组的组成。针对分类变量与分类变量的情况,我们提出一种启发式方法来确定最优空间利用的区间大小。为验证我们的工作,我们开展了一项众包用户研究,结果表明:与抖动散点图相比,聚散图能让人们更快速、更准确地评估数据分布。
相关内容
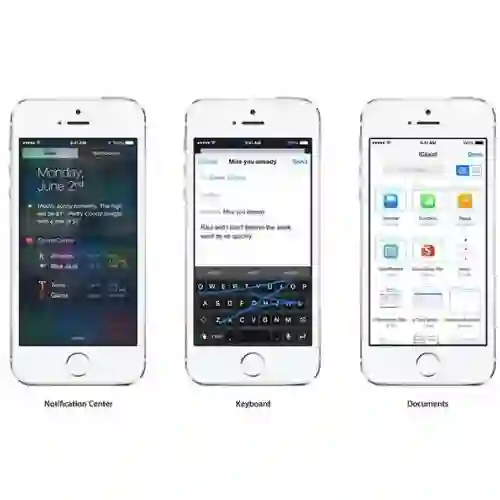
- Today (iOS and OS X): widgets for the Today view of Notification Center
- Share (iOS and OS X): post content to web services or share content with others
- Actions (iOS and OS X): app extensions to view or manipulate inside another app
- Photo Editing (iOS): edit a photo or video in Apple's Photos app with extensions from a third-party apps
- Finder Sync (OS X): remote file storage in the Finder with support for Finder content annotation
- Storage Provider (iOS): an interface between files inside an app and other apps on a user's device
- Custom Keyboard (iOS): system-wide alternative keyboards
Source: iOS 8 Extensions: Apple’s Plan for a Powerful App Ecosystem