Memory profiling captures programs' dynamic memory behavior, assisting programmers in debugging, tuning, and enabling advanced compiler optimizations like speculation-based automatic parallelization. As each use case demands its unique program trace summary, various memory profiler types have been developed. Yet, designing practical memory profilers often requires extensive compiler expertise, adeptness in program optimization, and significant implementation efforts. This often results in a void where aspirations for fast and robust profilers remain unfulfilled. To bridge this gap, this paper presents PROMPT, a pioneering framework for streamlined development of fast memory profilers. With it, developers only need to specify profiling events and define the core profiling logic, bypassing the complexities of custom instrumentation and intricate memory profiling components and optimizations. Two state-of-the-art memory profilers were ported with PROMPT while all features preserved. By focusing on the core profiling logic, the code was reduced by more than 65% and the profiling speed was improved by 5.3x and 7.1x respectively. To further underscore PROMPT's impact, a tailored memory profiling workflow was constructed for a sophisticated compiler optimization client. In just 570 lines of code, this redesigned workflow satisfies the client's memory profiling needs while achieving more than 90% reduction in profiling time and improved robustness compared to the original profilers.
翻译:内存分析能够捕获程序的动态内存行为,帮助程序员进行调试、调优,并支持先进的编译器优化(如基于推测的自动并行化)。由于每种用例都需要独特的程序跟踪摘要,因此已开发出多种类型的内存分析工具。然而,设计实用的内存分析器通常需要丰富的编译器专业知识、精通程序优化技巧以及大量的实现工作。这往往导致对快速且鲁棒的分析工具的期望无法实现。为填补这一空白,本文提出PROMPT,一个用于简化快速内存分析器开发的先驱性框架。借助该框架,开发者仅需指定分析事件并定义核心分析逻辑,无需处理自定义插桩及复杂的内存分析组件和优化工作。两个最先进的内存分析器已通过PROMPT移植并保留全部功能。通过聚焦核心分析逻辑,代码量减少超过65%,分析速度分别提升5.3倍和7.1倍。为进一步突显PROMPT的影响力,我们为复杂的编译器优化客户端构建了定制化内存分析工作流。该工作流仅用570行代码即满足客户的内存分析需求,与分析时间减少90%以上及相比原分析器鲁棒性提升的目标。

相关内容
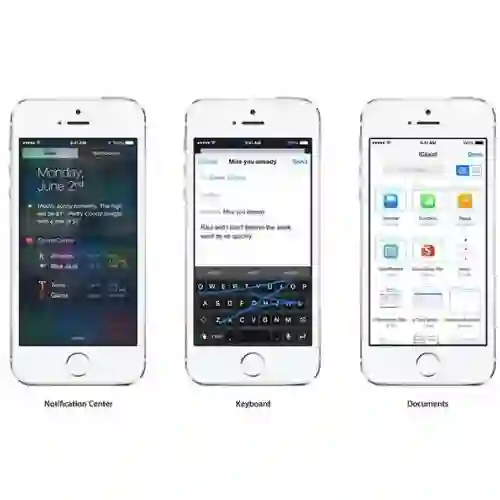
- Today (iOS and OS X): widgets for the Today view of Notification Center
- Share (iOS and OS X): post content to web services or share content with others
- Actions (iOS and OS X): app extensions to view or manipulate inside another app
- Photo Editing (iOS): edit a photo or video in Apple's Photos app with extensions from a third-party apps
- Finder Sync (OS X): remote file storage in the Finder with support for Finder content annotation
- Storage Provider (iOS): an interface between files inside an app and other apps on a user's device
- Custom Keyboard (iOS): system-wide alternative keyboards
Source: iOS 8 Extensions: Apple’s Plan for a Powerful App Ecosystem