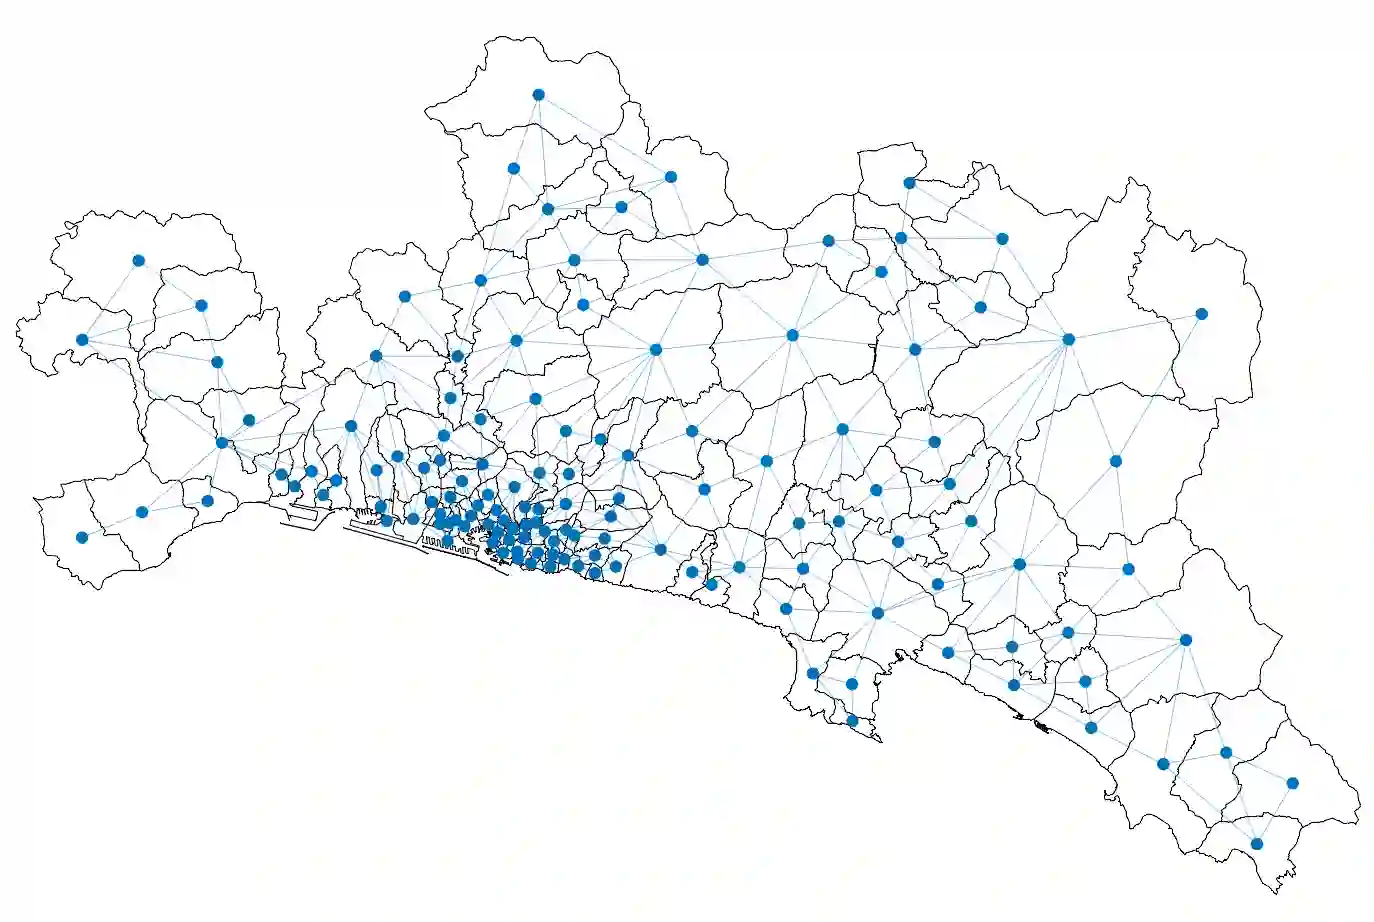
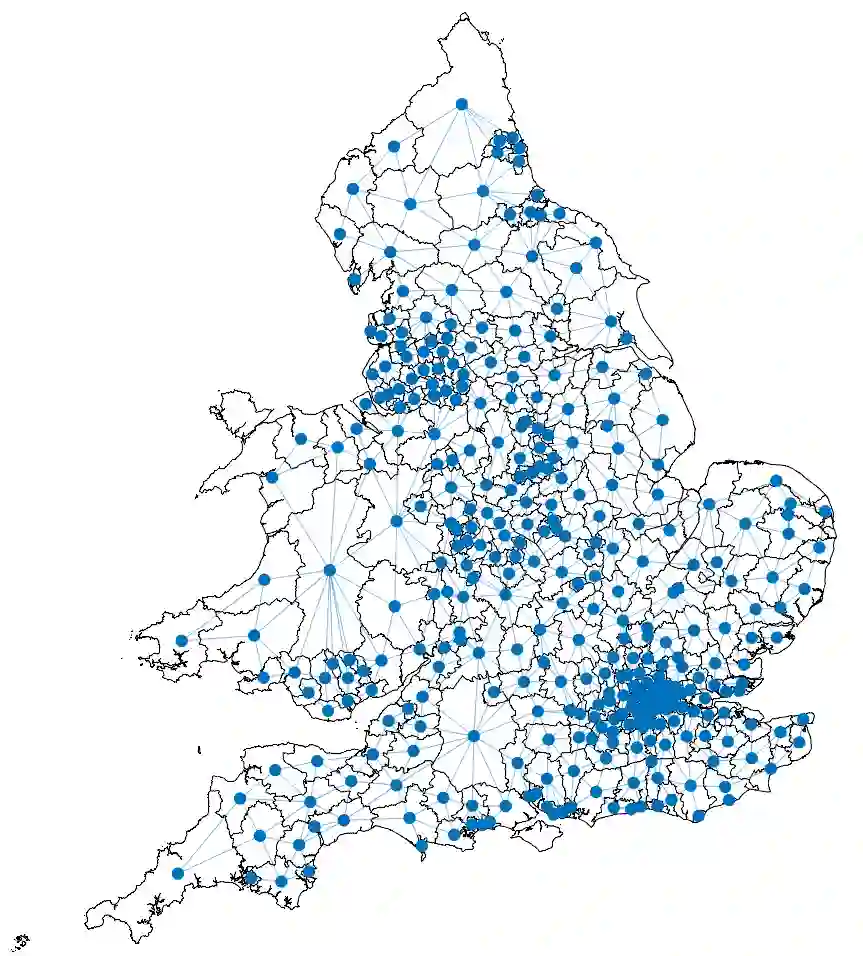
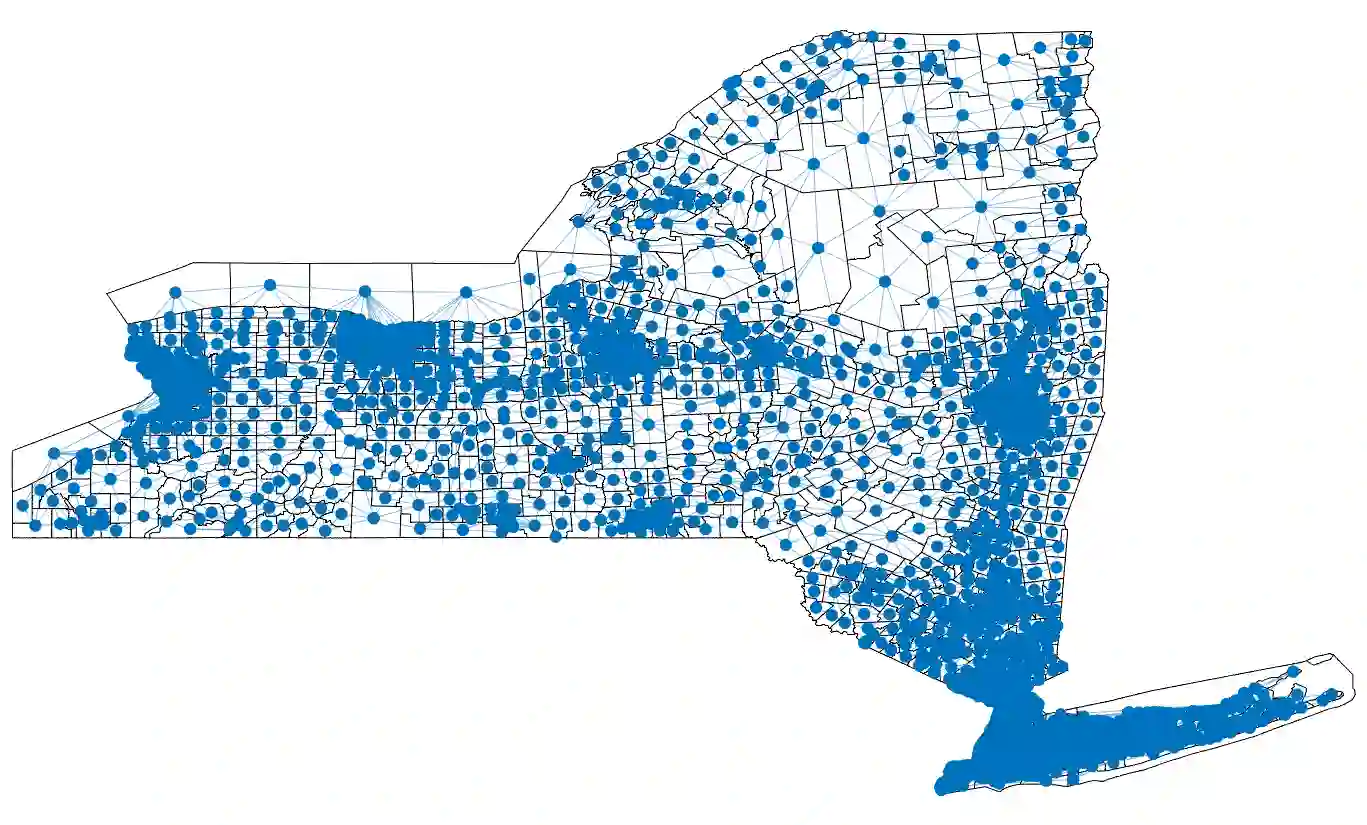
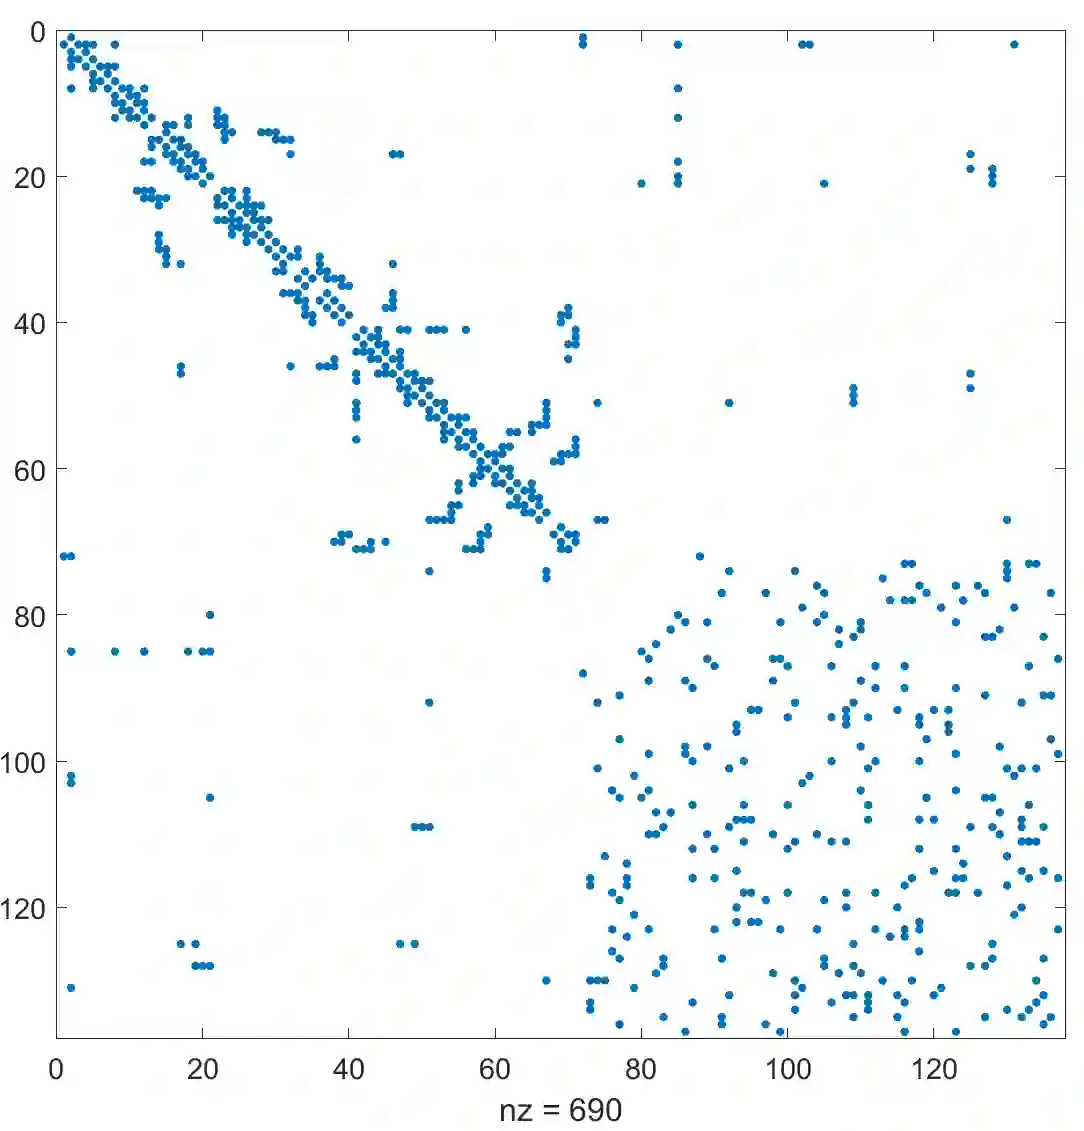
Urban mobility forecast and analysis can be addressed through grid-based and graph-based models. However, graph-based representations have the advantage of more realistically depicting the mobility networks and being more robust since they allow the implementation of Graph Theory machinery, enhancing the analysis and visualisation of mobility flows. We define two types of mobility graphs: Region Adjacency graphs and Origin-Destination graphs. Several node centrality metrics of graphs are applied to identify the most relevant nodes of the network in terms of graph connectivity. Additionally, the Perron vector associated with a strongly connected graph is applied to define a circulation function on the mobility graph. Such node values are visualised in the geographically embedded graphs, showing clustering patterns within the network. Since mobility graphs can be directed or undirected, we define several Graph Laplacian for both cases and show that these matrices and their spectral properties provide insightful information for network analysis. The computation of node centrality metrics and Perron-induced circulation functions for three different geographical regions demonstrate that basic elements from Graph Theory applied to mobility networks can lead to structure analysis for graphs of different connectivity, size, and orientation properties.
翻译:城市移动预测与分析可以通过基于网格和基于图的模型来实现。然而,基于图的表示具有能更真实地描绘移动网络且更稳健的优势,因为它们允许实施图论机制,从而增强移动流的分析与可视化。我们定义了两类移动图:区域邻接图和起讫图。应用图的多种节点中心性度量来识别网络中在图连通性方面最相关的节点。此外,与强连通图相关联的Perron向量被用于定义移动图上的循环函数。这些节点值在地理嵌入图中被可视化,展示了网络内的聚类模式。由于移动图可以是有向或无向的,我们针对这两种情况定义了多种图拉普拉斯算子,并表明这些矩阵及其谱性质为网络分析提供了有深刻见解的信息。对三个不同地理区域的节点中心性度量和由Perron引起的循环函数的计算表明,应用于移动网络的基本图论元素可以导致对不同连通性、尺寸和方向属性的图进行结构分析。