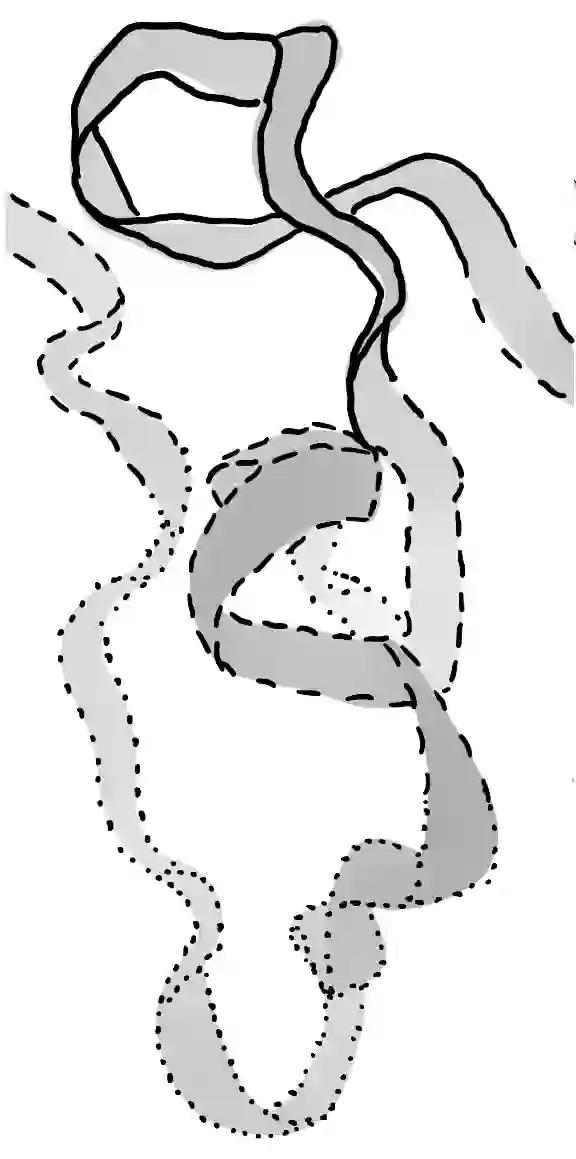
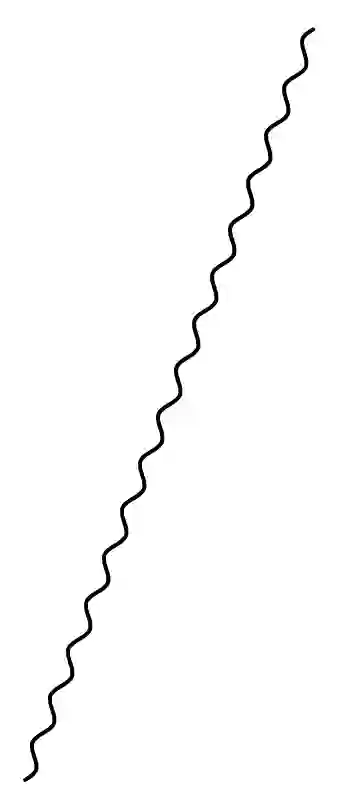
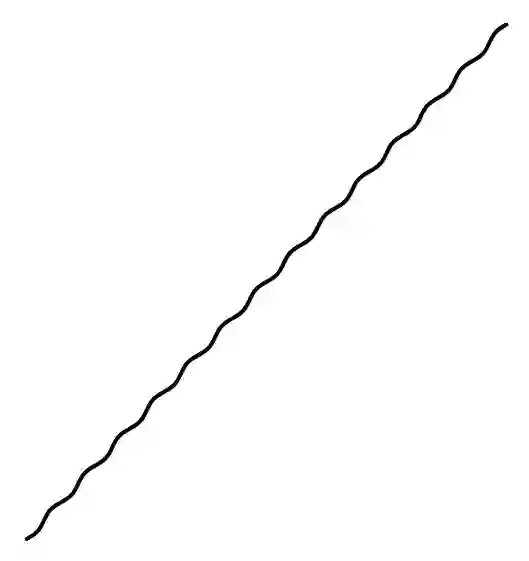
Line attributes such as width and dashing are commonly used to encode information. However, many questions on the perception of line attributes remain, such as how many levels of attribute variation can be distinguished or which line attributes are the preferred choices for which tasks. We conducted three studies to develop guidelines for using stylized lines to encode scalar data. In our first study, participants drew stylized lines to encode uncertainty information. Uncertainty is usually visualized alongside other data. Therefore, alternative visual channels are important for the visualization of uncertainty. Additionally, uncertainty -- e.g., in weather forecasts -- is a familiar topic to most people. Thus, we picked it for our visualization scenarios in study 1. We used the results of our study to determine the most common line attributes for drawing uncertainty: Dashing, luminance, wave amplitude, and width. While those line attributes were especially common for drawing uncertainty, they are also commonly used in other areas. In studies 2 and 3, we investigated the discriminability of the line attributes determined in study 1. Studies 2 and 3 did not require specific application areas; thus, their results apply to visualizing any scalar data in line attributes. We evaluated the just-noticeable differences (JND) and derived recommendations for perceptually distinct line levels. We found that participants could discriminate considerably more levels for the line attribute width than for wave amplitude, dashing, or luminance.
翻译:线条属性(如宽度和虚线)常被用于编码信息。然而,关于线条属性感知的许多问题仍待解答,例如可区分的属性变化层级数量,或不同任务场景下应优先选择哪种线条属性。我们通过三项研究建立了使用风格化线条编码标量数据的指南。第一项研究中,参与者使用风格化线条编码不确定性信息。不确定性通常需与其他数据共同可视化,因此替代性视觉通道对不确定性可视化至关重要。此外,不确定性(如天气预报中的不确定性)对大多数人而言是熟悉的话题,故我们在研究1的可视化场景中选取该主题。基于研究结果,我们确定了绘制不确定性时最常用的线条属性:虚线、亮度、波幅和宽度。这些线条属性虽在不确定性绘制中尤为常见,但同样广泛应用于其他领域。研究2和研究3进一步探究了研究1所述线条属性的可辨别性。这两项研究无需特定应用领域,其结论可推广至任何通过线条属性可视化标量数据的场景。我们通过评估恰可察觉差(JND)提出了感知可区分的线条层级建议。结果表明,参与者对线条宽度属性的可区分层级数量显著高于波幅、虚线或亮度。