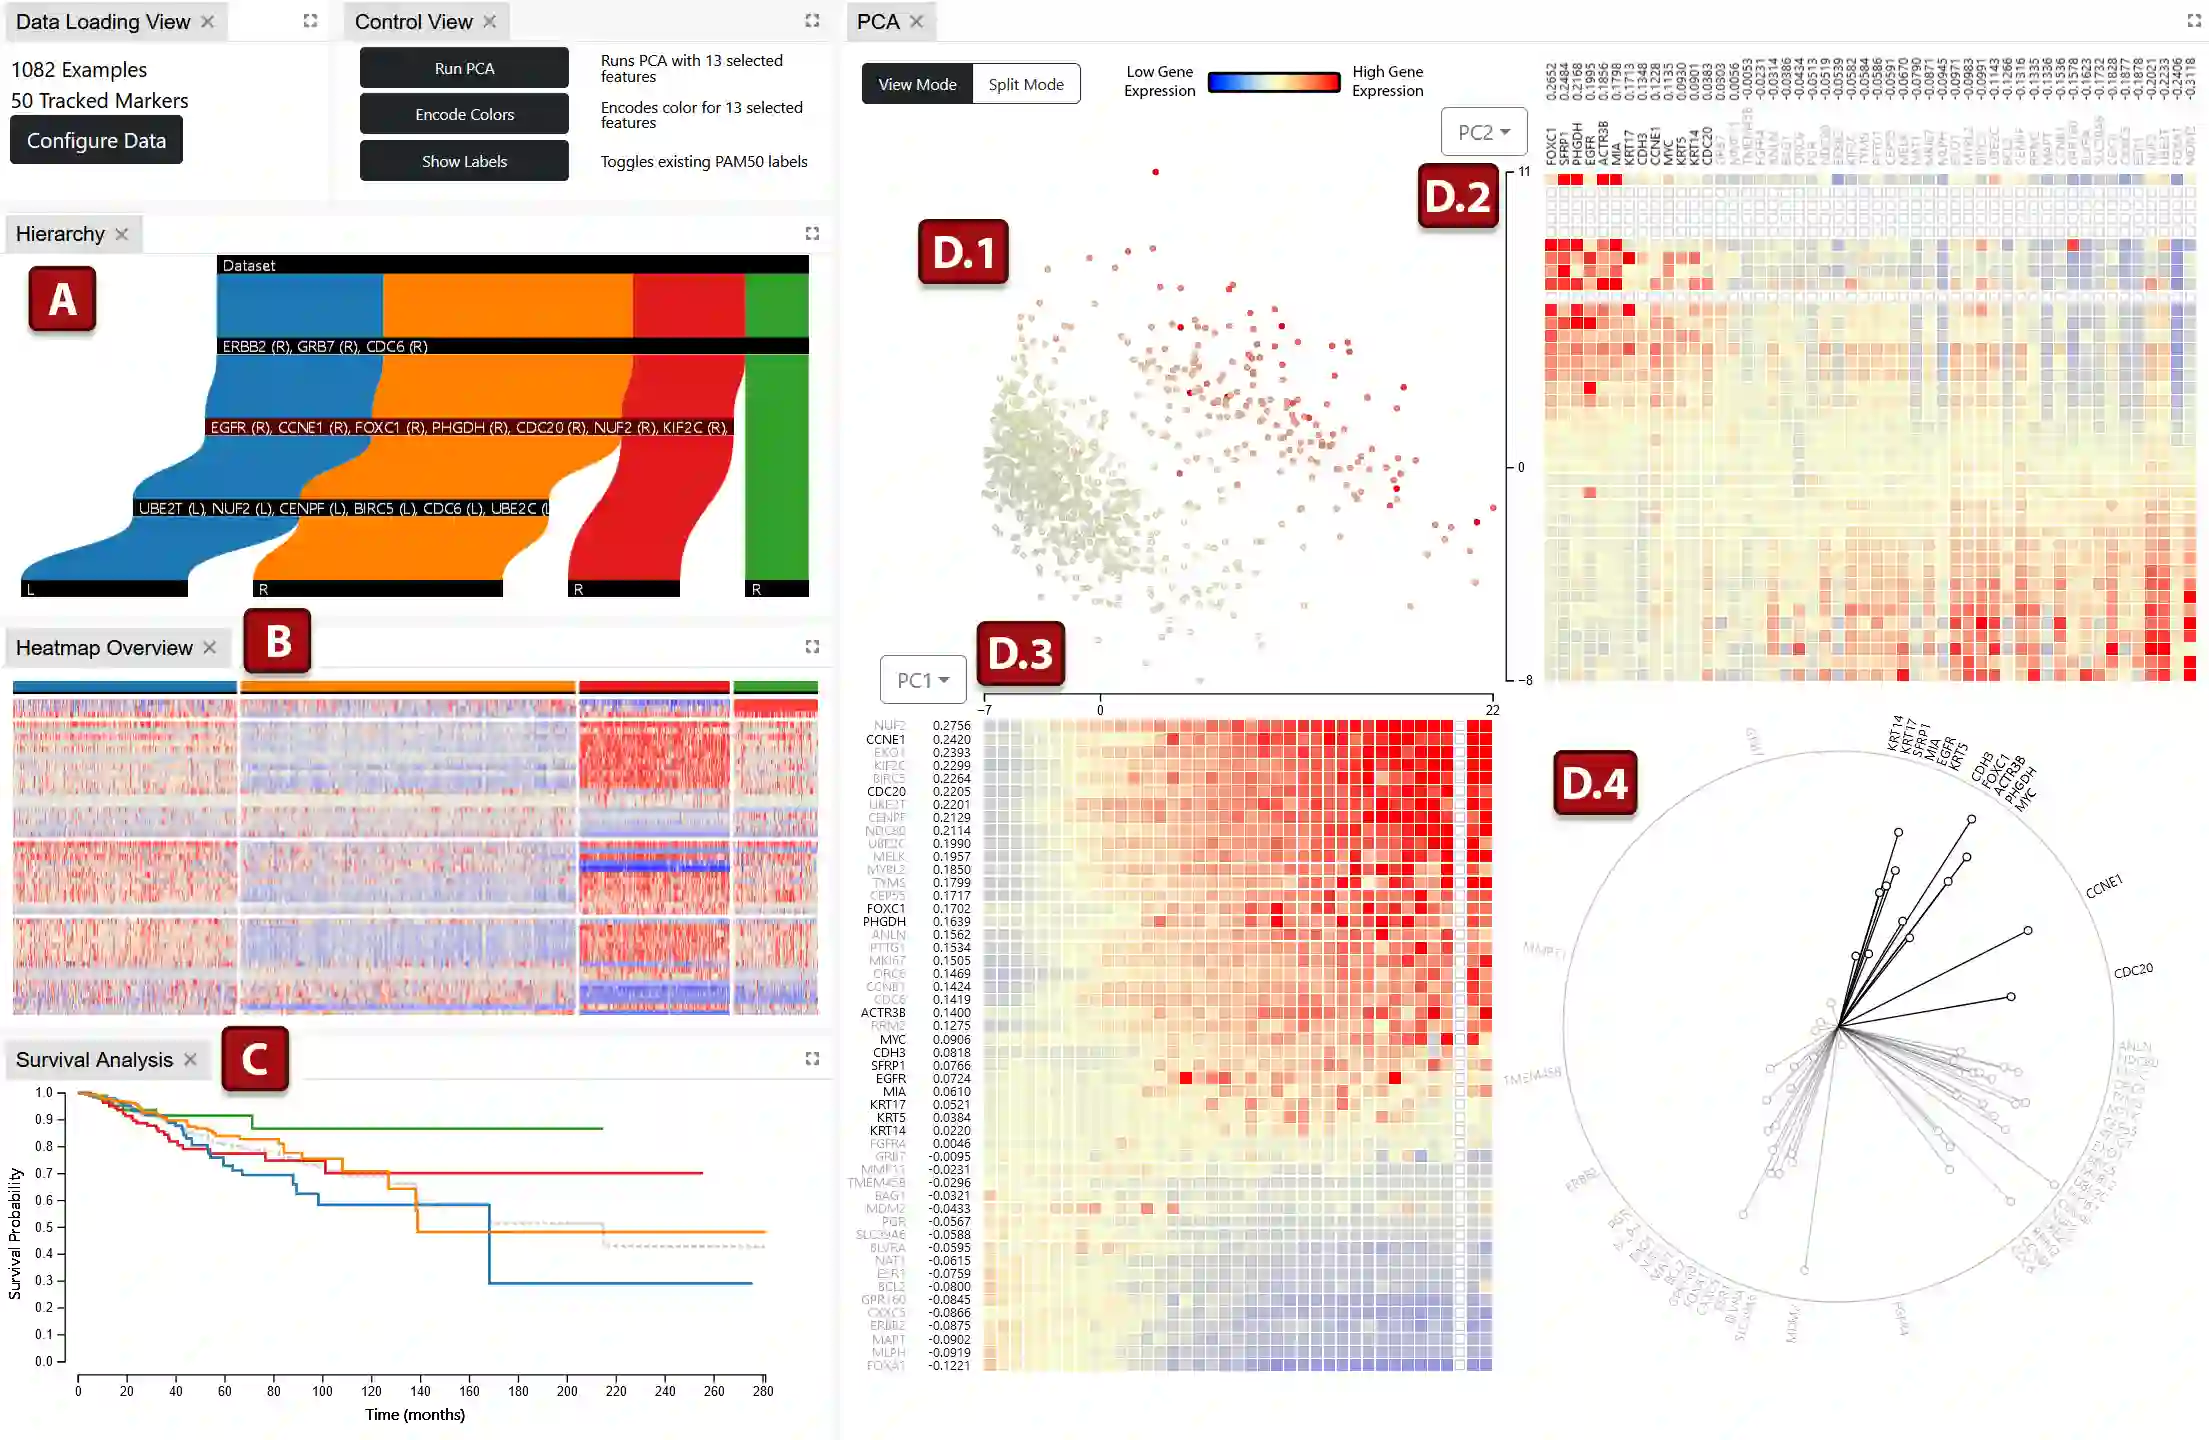
We propose an interactive visual analytics tool, Vis-SPLIT, for partitioning a population of individuals into groups with similar gene signatures. Vis-SPLIT allows users to interactively explore a dataset and exploit visual separations to build a classification model for specific cancers. The visualization components reveal gene expression and correlation to assist specific partitioning decisions, while also providing overviews for the decision model and clustered genetic signatures. We demonstrate the effectiveness of our framework through a case study and evaluate its usability with domain experts. Our results show that Vis-SPLIT can classify patients based on their genetic signatures to effectively gain insights into RNA sequencing data, as compared to an existing classification system.
翻译:我们提出了一种交互式可视化分析工具Vis-SPLIT,用于将个体群体划分为具有相似基因特征的子群。Vis-SPLIT允许用户交互式地探索数据集,并利用可视化分离能力为特定癌症构建分类模型。其可视化组件可揭示基因表达与相关性,辅助具体划分决策,同时为决策模型和聚类后的遗传特征提供全局视图。我们通过案例研究证明了该框架的有效性,并邀请领域专家评估了其可用性。结果表明:与现有分类系统相比,Vis-SPLIT能够基于遗传特征对患者进行分类,从而有效获取RNA测序数据的深层见解。